Article Text

Abstract
Objective Elucidating complex ecosystems and molecular features of gallbladder cancer (GBC) and benign gallbladder diseases is pivotal to proactive cancer prevention and optimal therapeutic intervention.
Design We performed single-cell transcriptome analysis on 230 737 cells from 15 GBCs, 4 cholecystitis samples, 3 gallbladder polyps, 5 gallbladder adenomas and 16 adjacent normal tissues. Findings were validated through large-scale histological assays, digital spatial profiler multiplexed immunofluorescence (GeoMx), etc. Further molecular mechanism was demonstrated with in vitro and in vivo studies.
Results The cell atlas unveiled an altered immune landscape across different pathological states of gallbladder diseases. GBC featured a more suppressive immune microenvironment with distinct T-cell proliferation patterns and macrophage attributions in different GBC subtypes. Notably, mutual exclusivity between stromal and immune cells was identified and remarkable stromal ecosystem (SC) heterogeneity during GBC progression was unveiled. Specifically, SC1 demonstrated active interaction between Fibro-iCAF and Endo-Tip cells, correlating with poor prognosis. Moreover, epithelium genetic variations within adenocarcinoma (AC) indicated an evolutionary similarity between adenoma and AC. Importantly, our study identified elevated olfactomedin 4 (OLFM4) in epithelial cells as a central player in GBC progression. OLFM4 was related to T-cell malfunction and tumour-associated macrophage infiltration, leading to a worse prognosis in GBC. Further investigations revealed that OLFM4 upregulated programmed death-ligand 1 (PD-L1) expression through the MAPK-AP1 axis, facilitating tumour cell immune evasion.
Conclusion These findings offer a valuable resource for understanding the pathogenesis of gallbladder diseases and indicate OLFM4 as a potential biomarker and therapeutic target for GBC.
- gallbladder cancer
- adenoma
- polyp
- inflammation
Data availability statement
Data are available upon reasonable request.
This is an open access article distributed in accordance with the Creative Commons Attribution Non Commercial (CC BY-NC 4.0) license, which permits others to distribute, remix, adapt, build upon this work non-commercially, and license their derivative works on different terms, provided the original work is properly cited, appropriate credit is given, any changes made indicated, and the use is non-commercial. See: http://creativecommons.org/licenses/by-nc/4.0/.
Statistics from Altmetric.com
WHAT IS ALREADY KNOWN ON THIS TOPIC
Gallbladder cancer (GBC) is one of the most common biliary tract cancers, with a particularly poor prognosis and limited therapeutic options when diagnosed at advanced stages.
Gallbladder diseases, ranging from benign to malignant conditions, involve persistent inflammation, irrespective of lithogenic or non-lithogenic origins.
The development of GBC primarily occurs through metaplasia-dysplasia-carcinoma or adenoma-carcinoma sequences, with the latter involving 5–10% of cases.
WHAT THIS STUDY ADDS
We delineated a comprehensive landscape of the microenvironment within different pathological states of gallbladder diseases and highlighted the features of different GBC subtypes.
Stromal-immune cell exclusivity unveiled a complex stromal ecosystem (SC) in GBC progression, indicating SC1, characterised by active interaction between Fibro-iCAF and Endo-Tip cells was associated with poor prognosis.
Molecular profiling identified intrinsic transcriptional variations within adenocarcinoma, establishing an evolutionary similarity between adenoma and adenocarcinoma.
Olfactomedin 4 (OLFM4) was elevated in GBC, which played a crucial role in facilitating a tumour-evading microenvironment, particularly by enhancing programmed death-ligand 1 expression via MAPK-AP1 axis and recruiting tumour-associated macrophages.
HOW THIS STUDY MIGHT AFFECT RESEARCH, PRACTICE OR POLICY
The comprehensive transcriptome atlas offers insights into GBC heterogeneity and precancerous transitions, laying a groundwork for devising targeted therapies through understanding the complex microenvironment and genetic variations.
This study identified OLFM4 as a key modulator in GBC progression, highlighting its potential as a diagnostic marker and therapeutic target.
Introduction
Gallbladder cancer (GBC) is a highly lethal disease, predominantly identified at an advanced stage owing to its atypical symptoms.1 2 Early-stage GBC is often diagnosed incidentally after cholecystectomy for a presumed benign disease by pathologists.3 Surgical resection is currently a recognised treatment for GBC, yet a limited number of cases qualify for such resection and most adjuvant therapy has shown an undesirable response rate.4 Therefore, to improve GBC management, several critical challenges have to be addressed including the identification of reliable biomarkers for screening, clinical management and prognosis prediction.4 5
Covering a spectrum from benign to malignant conditions, gallbladder diseases pose a significant medical challenge.6 Approximately 95% of GBCs originate from epithelial cells and adenocarcinoma (AC) is the predominant histological type, accounting for over 90% of cases.7 The pathogenesis of GBC often follows metaplasia-dysplasia-carcinoma or adenoma-carcinoma sequence.8 9 Persistent inflammation exists in both pathogenic ways and plays a pivotal role in driving the tumourigenesis of GBC, regardless of its lithogenic10 or non-lithogenic origin.11 12 Although 90% of patients with GBC exhibit gallstones,13–15 only 1% of gallstone patients progress to GBC.16 Chronic inflammation17 also intertwines with risk factors such as Salmonella enterica serovar Typhi infection,18 pancreaticobiliary duct anomalies,19 metabolic syndrome20 and gallbladder polypoid lesions to complicate the process. Thus, the transition of GBCs from precancerous lesions could be intervened with a better understanding of inflammation-driven tumour initiation and progression.19
The advances in omics technologies have provided novel insights into the mutational landscape, molecular characteristics and dysregulation of signalling pathways, leading to the emergence of several therapeutic targets, such as HER2, VEGFR and PD-(L)1.21–23 However, trials targeting these molecules have shown minimal impact on overall survival.24 25 Since the thriving application of single-cell RNA sequencing (scRNA-seq) in deciphering the tumour microenvironment, much emphasis was put on the heterogeneity of the tumour ecosystem to provide novel clues for cancer therapy, especially the complex interaction within different cell subtypes. Understanding the intricate crosstalk between cellular components and the microenvironment sheds light on the malignant transformation and what triggers GBC progression.26 27
In this study, we obtained whole-genome sequencing (WGS) and scRNA-seq data of gallbladder disease clinical samples, including cholecystitis, polyps, adenomas and GBCs to unveil the molecular signatures and heterogeneity of the microenvironment. Olfactomedin 4 (OLFM4), a modulator originating from the malignant epithelium of GBCs was identified and its role in regulating programmed death-ligand 1 (PD-L1) and the tumour microenvironment was validated. This investigation aims to illuminate the underlying mechanisms driving gallbladder disease progression and provide insights into potential therapeutic targets for GBCs.
Methods
Patient cohorts
Specimens of patients who underwent surgical resection with gallbladder diseases at Eastern Hepatobiliary Surgery Hospital were collected and clinical data was sourced from electronic medical records under informed consent. The pathology of each patient was confirmed by at least three pathologists. Additional samples for digital spatial profiler (DSP) GeoMx were from Shanghai Outdo Biotech (Refer to online supplemental material for more methodologies).
Supplemental material
Results
Diverse tissue-lineage states and cell populations identified via scRNA-seq of 230 737 cells
This study performed scRNA-seq analysis of 43 clinical samples from 27 patients, including 4 gallbladder cholecystitis (GC), 3 gallbladder polyps (GP), 5 gallbladder adenomas (GA) and 15 GBC (1 squamous cell carcinoma, SCC; 2 adenosquamous carcinomas, Mixed; and 12 AC), along with 16 matched adjacent normal tissues (ANT, 1 from GC, 1 from GP, 2 from GA, 1 from SCC, 1 from mixed and 10 from AC) (figure 1A). The clinicopathological information of each patient was presented in figure 1B, online supplemental table S1 and figure S1A.

Landscape of precancerous lesions of gallbladder and gallbladder cancer by scRNA-seq of 43 samples. (A) Overview of the study design and sample composition. (B) Clinicopathological profiles of samples enrolled in scRNA-seq cohort. (C) Uniform Manifold Approximation and Projection unveiling seven major cell lineages. (D) Visualisation of alterations in major lineages composition among groups through cell density mapping. (E) Boxplots revealing the frequency of major cell compartments across different groups. Statistical significance was evaluated via the Kruskal-Wallis’ test. (F) Pie charts illustrating the predominant lineage composition among diverse GBC subtypes. (G) Phenotypic relationships and population abundance of 64 cell subsets excluding five patient-specific clusters. Unsupervised hierarchical clustering of cell subsets (top panel). Bar plot showing the distribution of cell subsets across seven tissue subtypes (middle panel). Heatmap at the bottom showing tissue prevalence estimated by Ro/e score for each cell subset. AC, adenocarcinomas; AJCC, American Joint Committee on Cancer; ANT, adjacent normal tissues; GA, gallbladder adenomas; GBC, gallbladder cancer; GC, gallbladder cholecystitis; GP, gallbladder polyps; NK, natural killer; SCC, squamous cell carcinoma; sc-RNA-seq, single-cell RNA sequencing; TNM, tumour, node, metastasis.
To get an overview of the mutational landscape, we first evaluated mutational patterns in samples from the WGS cohort with somatic mutation calling (online supplemental figure S1B). Notably, 58% of GBC samples exhibited TP53 and RTK-RAS mutations. GA displayed the highest mutational burden with an APC gene mutation, aligning with previous reports.28 While relevant genetic mutations were not detected in GP and GC.
For scRNA-seq, after rigorous quality control, 230 737 cells were classified into seven major cell types, encompassing epithelial, stromal (fibroblasts and endothelium), lymphoid (T/natural killer (NK), B/plasma and mast cells) and myeloid cells (monocytes, macrophages and dendritic cell) (figure 1C and online supplemental figure S1C). Traditionally, rapid cell proliferation is closely associated with pluripotency and stemness.29 Consistently, the fewest lymphoid cells were in the G1 phase, while epithelial and stromal cells exhibited prolonged G1 phases. The relatively lower proliferative activity of epithelium may be attributed to the inclusion of normal epithelium. GBCs showed a higher proportion of cells in the G2 and S phases when compared with other groups, indicating increased proliferation (online supplemental figure S1D).
Further cellular composition analysis suggested a slightly different cell distribution pattern in each group. Myeloid cells and epithelium might be the predominant subpopulations in GP and GA, respectively. GBC and ANT showed a similar cell composition (figure 1D,E). While lymphoid cells and fibroblast proportion varied in different GBC subtypes (figure 1F). This observation underscores the necessity for unravelling the cellular heterogeneity across various pathological stages of gallbladder diseases.
After removing batch effects and clustering, we established a cell atlas with 69 subpopulations (online supplemental figure S1E and table S2). Comparative analysis highlighted the distinguished pattern of each group (figure 1G). Endothelium and epithelium clusters were enriched in ANT and GC, while GP and GA were enriched in immunocompetent cells, such as CD8+ effector T (CD8-Teff) and CD8+ effector memory T (CD8-Tem), and specific epithelial subtypes (ie, Goblet and Paneth cells). As expected, GBC exhibited abundant immunosuppressive immune cells (such as regulatory T (CD4-Treg) and CD8+ exhausted T (CD8-Tex)) and stromal cells (Fibro-iCAF), aligning with their role in tumourigenesis. Despite the similarity of subpopulation distribution, differences among the three GBC pathological types were not to be neglected.
Altered subpopulation patterns of immune cells in the pathogenesis of gallbladder diseases
Next, unsupervised clustering analysis revealed 14 subpopulations of lymphoid cells, including CD3+T cells (naive, early effector, cycling), CD4+T cells (pre-Treg, Treg, follicular helper T (Tfh)), CD8+T cells (effector, effector memory, memory, resident memory, Tc17, exhausted) and NK cell subsets (figure 2A and online supplemental figure S2A).

Characterisation of immune cell states throughout disease progression. (A) UMAP showing illustrating distinct subsets of T/NK cells. (B) Clonal expansion status of T cells shown as cell counts. (C) Proportion of the CD3-Cycling among different groups. (D) Heatmap displaying the clonal expansion of each T subset stratified by tissue subtypes. (E) Heatmap revealing clonal transitions between CD8-Tex and other clusters, stratified by tissue subtypes. (F) RNA velocity overlaid on UMAP of T cells, demonstrating potential transitional paths to CD8-Tex. (G) UMAP exhibiting subpopulations of Cycling T/NK cells. (H) Proportions of subpopulations of Cycling T/NK cells in each tissue subtype represented by Pie chart (top panel) and bar plot (bottom panel). (I) Immunofluorescence staining illustrating the dominance of cycling CD8-Tex in AC compared with the other two GBC subtypes. (J) UMAP showing subsets of myeloid cells identified in monocytes, macrophages and DCs. (K) Proportion of cCD3 among different groups. (L) Immunofluorescence staining confirms the presence of cCD3 in GBC. (N) Venn diagram illustrates six overlapping genes representing TAMs in GBC. (M) Heatmaps showing distinct expression patterns of function-associated signature genes among seven macrophage subsets in tissue subtypes. AC, adenocarcinomas; ANT, adjacent normal tissues; cDC, classical DC; DC, dendritic cell; GA, gallbladder adenomas; GBC, gallbladder cancer; GC, gallbladder cholecystitis; GP, gallbladder polyps; NK, natural killer; NKT, natural killer T; pDC, plasmacytoid DC; SCC, squamous cell carcinoma; TAM, tumour-associated macrophage; Teff, effector T; Tem, effector memory T; Tex, exhausted T; Tfh, follicular helper T; Tm, memory T; Treg, regulatory T; Trm, tissue-resident memory T; UMAP, Uniform Manifold Approximation and Projection.
Detailed examination of T-cell receptor (TCR) clonal expansion highlighted CD8+T cells abundant in memory and exhausted subsets (figure 2B). An average of approximately 80% of CD8+T cells harboured TCRs, with minimal variations across tissue types. Notably, GP showed elevated TCR rates and increased identical CDR3 lengths (online supplemental figure S2B).
According to the subpopulation distribution presented in figure 1G, CD4-Tfh, CD4-Treg, CD8-Tex and CD3-Cycling were enriched in GBC (figure 2C and S2C). CD8-Tex exhibited extensive TCR expansion, notably in mixed GBC and GC (figure 2D and online supplemental figure S2C). Cells sharing identical TCR clonotypes with CD8-Tex were enriched within CD8-Teff, CD8-Trm, CD8-Tem and CD3-Cycling (figure 2E), suggesting a potential origin, as supported by RNA velocity analysis (figure 2F). Given the significant increase in CD3-Cycling in GBC, a subpopulation crucial for exhausted CD8+T cells, we then analysed its cellular composition illustrating the categorisation of proliferating T-cell subpopulations. In precancerous lesions, predominant proliferating T cells were functionally active, including CD8-Teff and CD8-Tem. Conversely, GBC showed proliferation of Treg, especially in SCC and exhausted CD8+T cells, particularly in AC. The Treg to CD8-Tex ratio in mixed GBC fell between SCC and AC, which was further validated through multiple immunohistochemistry (IHC) (figure 2G–2I and D).
Macrophages, diverse across GBC and precancerous lesions, exhibited elevated subtypes in GBC (Macro-CCL18, Macro-CXCL10, Macro-MT1G, Macro-SPP1) and precancerous lesions (Macro-C1QC, Macro-LYVE1, Macro-RGS16) (figure 2J and online supplemental figure S2E,F), while cDC3 expressing LAMP3 upregulated in GBC (figure 2K–2L). Enriched macrophage subtypes in GBC manifest the highest functional scores in M2-like, anti-inflammatory, angiogenesis and immune checkpoint blockade (ICB) (figure 2M). Comparing macrophages from GBC with other precancerous samples identified a consistent expression pattern across the three pathological types (online supplemental figure S2G), encompassing upregulation of six key genes (figure 2N), including metalloproteinase family (eg, MMP12), osteopontin (ie, SPP1) and various chemokines (eg, CXCL10), which held promise as potential targets in cancer treatment. Proliferative myeloid cells were abundant in GP, probably due to the role of macrophages in inflammation which was also validated in clinical samples (online supplemental figure S2H,I).
Overall, lymphoid cell patterns and the core genes of tumour-associated macrophage (TAM) provided implications for the GBC pathogenesis.
Enhanced plasticity and remodelling of stromal cells during GBC progression
Stromal compartment, encompassing fibroblasts, endothelium and other cell types like pericytes and smooth muscle cells, revealed remarkable heterogeneity in gallbladder diseases (figure 3A,B). A subgroup with glial cell characteristics resembling Schwann cells emerged, suggesting a potential similarity between GBC and pancreatic cancer, given their shared developmental lineage with the biliary system,30 particularly in terms of peripheral nerve infiltration (online supplemental figure S3A–C).

Phenotypic abundance and interactions of stromal cells. (A) UMAP of subpopulations of fibroblasts. (B) UMAP of subpopulations of endothelial cells. (C) Correlation analysis among TME subsets in all samples based on corresponding relative abundance. P values were calculated using the Spearman correlation test with Benjamini-Hochberg correction for multiple comparisons. (D) Inference of three ecotypes based on stromal cell compositions in the 43 samples. (E) Survival analysis of SC1 and SC3 gene signature across all cancer types from TCGA. Optimal cut points were determined using the survminer package. (F) Deconvolution of SC1 and SC3 cellular ecotypes in cohort by Pandey et al. (G) KEGG enrichment analysis of SC1 and SC3 ecotypes. (H) Violin plots showing significant differences in signature scores of SC1 and SC3 between patients with well-differentiated and poor-differentiated GBC. AC, adenocarcinomas; ANT, adjacent normal tissues; ECM, extracellular matrix; GA, gallbladder adenomas; GBC, gallbladder cancer; GC, gallbladder cholecystitis; GP, gallbladder polyps; KEGG, Kyoto Encyclopedia of Genes and Genomes; SCC, squamous cell carcinoma; TCGA,The Cancer Genome Atlas; TME, tumour microenvironment; UMAP, Uniform Manifold Approximation and Projection.
Gallbladder, characterised by substantial collagen content, exhibits a pathological landscape with a notable stromal presence.31 A correlation analysis highlighted mutual exclusivity between stromal and immune cells (green box) and positive correlations among fibroblasts and endothelial cells (yellow box). A favourable correlation between lymphoid cells and myeloid cells, as well as pericytes and endothelium, suggested cell–cell interactions in microenvironment remodelling (figure 3C).
To understand phenotypic diversity within stromal cell subsets, we quantified cellular compositions across all samples, identifying three distinct stromal ecosystems (SC). Remarkably, SC1, mainly composed of Fibro-iCAF, Endo-Tip cells and pericytes, and SC3 enriched with fibroblast subtypes were predominantly observed in tumour samples. While SC2, dominant with endothelial subtypes prevailed in the non-tumour samples (figure 3D). Fibro-iCAF and Endo-Tip cells, known to spearhead angiogenesis in tumourigenesis,32 were accumulated in samples with SC1 features (online supplemental figure S3D,E). Crosstalk analysis revealed that interactions among different cell types were significantly intensified in GBC compared with other groups (online supplemental figure S3F.G). Notably, among ligands interacting with Endo-Tip cells, TGFB1 and COL18A1 were tremendously upregulated in GBCs, triggering downstream signalling pathways (online supplemental figure S3H–J).
Accordingly, SC1 and SC3 signatures correlated with less favourable prognosis across cancers in The Cancer Genome Atlas (TCGA) cohort (n=10 535), particularly stroma-rich tumours like pancreatic and breast cancer (figure 3E; online supplemental table S3). Furthermore, unsupervised hierarchical clustering of bulk RNA sequencing (RNA-seq) data from GBC samples by Pandey et al,26 also revealed SC1-like and SC3-like subgroups (figure 3F), with SC1-like patients exhibiting abnormally activated pro-tumour pathways, such as the PI3K-AKT and extracellular matrix pathways. While SC3-like patients retained partial gallbladder functions (figure 3G). Likewise, within the scRNA-seq data set, GBC samples with poor differentiation displayed elevated scores for the SC1 signature other than the SC3 signature (figure 3H), suggesting SC1 is a potential signature for worse patient prognosis.
These results emphasis a stromal-immune cell exclusivity in gallbladder diseases and enhanced interaction, notably between Fibro-iCAF and Endo-Tip cells in SC1, indicating worse patient prognosis.
Intricate molecular features of epithelium and evolutionary similarity between GA and AC
Next, copy number variation inference within epithelium distinguished malignant cells (online supplemental figure S4A). Shannon entropy revealed lower heterogeneity within the epithelium of GA and GBC compared with overall fibroblasts. Additionally, stromal cells displayed higher heterogeneity than immune cells (figure 4A). Precancerous tissues exhibited distinct epithelial cells (figure 4B and online supplemental figure S4B), including Paneth (expressing DEFA5 and DKK4) and Goblet cells (expressing PGC and MSMB) (figure 1G).

Epithelium cell subtypes recapitulated dynamics of cell differentiation and specific gene expression. (A) Inter-epithelium heterogeneity across groups, measured by Shannon entropy, alongside other major cell types. (B) UMAP of subpopulations of epithelium. (C) Pearson correlation clustering of intratumour expression programmes generating eight meta-programmes. The colour was proportional to the absolute value of the correlation. (D) Distribution of epithelium subtypes during the transition, illustrated alongside pseudotime. (E) PAGA analysis of epithelium, where each dot represented an epithelium cluster. (F) RNA velocities overlaid on UMAP depicting potential transition paths from AC to mixed and SCC. Arrows on a grid show the RNA velocity field, and dots are coloured by meta-clusters. (G) Trajectory reconstruction of all epitheliums revealed three branches: pre-branch (before bifurcation), cell fate one branch, and cell fate two branch (after bifurcation). Pie charts indicated tissue subtype proportions of the cell fate 1/2 branches, respectively. (H) Two-dimensional plots showing the dynamic expression of OLFM4 and VIM in a pseudotime manner. AC, adenocarcinomas; ANT, adjacent normal tissues; GA, gallbladder adenomas; GBC, gallbladder cancer; GC, gallbladder cholecystitis; GP, gallbladder polyps; NK, natural killer; OLFM4, olfactomedin 4; PAGA, partition-based graph abstraction; SCC, squamous cell carcinoma; UMAP, Uniform Manifold Approximation and Projection; VIM, vimentin.
Non-negative matrix factorisation33 was employed to uncover coherent genes preferentially co-expressed by malignant cells from AC. This analysis identified 8 meta-programmes with distinct biological activity among 11 AC samples (excluding GBC_14 due to limited cells; figure 4C and online supplemental figure S4C and table S4). The eight programmes featured RNA splicing, oxidative phosphorylation, cell cycle, epithelial differentiation, immune-related genes such as Major Histocompatibility Complex, Class II, DR Alpha (HLA-DRA), stress response, endocrine-related genes and epithelial-mesenchymal transition (EMT), respectively. This classification unveiled the heterogeneity within AC, shedding new light on molecular classification-based therapy.
Monocle 234 analysis revealed that epithelium in GA displayed similarities to malignant epithelium, suggesting their proximity to terminal stages of differentiation. Epithelium in the mixed subtype appeared to be undergoing a differentiation process actively. Two clusters of non-malignant epitheliums in an intermediate state, Epi-SAA1 and Epi-PAPLN, were identified (figure 4D). Connectivity structures between these subtypes were determined as the previous report indicated,35 which revealed a robust connection between Epi-SAA1 and both malignant and non-malignant epithelium, supporting Monocle 2 results (figure 4E). RNA velocity analysis suggested that Epi-SAA1 may play a pivotal role in facilitating the transition from non-malignant to malignant epithelium (figure 4F).
Epithelium pseudotime analysis unveiled three stages and two directions of cell fate. State 1 included precancerous samples. State 2 was predominantly made up of GA, with an emerging presence of GBC, while State 3 was primarily characterised by GBC. (figure 4G). In Cell Fate 1, the enrichment of pathways like the Wnt pathway and glandular development was commonly found elevated in adenoma cells. In Cell Fate 2, enriched signals were predominantly associated with cell adhesion and negative immune regulation pathways, which were associated with GBC differentiation. Robust activation of kinase signalling, oxidative phosphorylation, stress response and hypoxia signalling occurred throughout the ‘branching’ process (online supplemental figure S4D).
In summary, these findings revealed intricate gene expression programmes in AC and suggested a potential evolutionary similarity of GA and AC.
OLFM4 elevated in malignant epithelium of GBC
Within epithelium, a chronological augmentation of specific genes, such as vimentin (VIM) and OLFM4 over the pseudo-temporal progression was observed, particularly within cells undergone Cell Fate 2, a trajectory directed towards GBC (figure 4H).
Remarkably, OLFM4, a glycoprotein belonging to the olfactomedin family, prominently featured in the malignant but normal epithelium (online supplemental figure S4E). OLFM4 exhibited the highest expression within malignant cells of AC, followed by Epi-SAA1 (figure 5A,B). Multiplex IHC confirmed the expression of OLFM4 in AC epithelium (figure 5C). An appreciable escalation of OLFM4 in tumour bulks was discovered compared with ANT (figure 5D). IHC staining on 136 GBC samples indicated a significantly worse prognosis in the OLFM4-High group (figure 5E,F). Subsequently, OLFM4 levels in plasma specimens from patients, encompassing GC (n=13), GP (n=12), GA (n=12) and AC (n=47), were examined via ELISA. The findings showed a substantial elevation of OLFM4 levels in GA and GBC, surpassing those in GC and GP (figure 5G), providing further evidence of tumour evolution from GA to GBC. This insight was further validated through IHC analysis of patient tissues (figure 5H). Given that GA, a recognised precancerous lesion for AC also serves as an indication for surgical intervention, OLFM4 may play a role as a marker for patient screening.

OLFM4 was upregulated along with GBC progression and could be detected in peripheral blood. (A) Dot plot showing the expression of OLFM4 across epithelial subsets. (B) Dot plot depicting the expression of OLFM4 across tissue subtypes. (C) Multiplex IHC staining confirmed the specific expression of OLFM4 in gallbladder epithelium. (D) Western blot analysis of OLFM4 expression in GBC tissues compared with corresponding adjacent non-cancerous tissues. Quantification of results was displayed in the bar chart on the right. (E) Representative images of OLFM4 IHC staining, related to figure 5F. (F) Overall survival analysis of patients with GBC stratified by the OLFM4 expression level in 136 IHC samples. (G) Plasma levels of OLFM4 across the progression of gallbladder disease. (H) Representative IHC images showing the distribution pattern of OLFM4 (each group, n=3). AC, adenocarcinomas; ANT, adjacent normal tissues; GA, gallbladder adenomas; GBC, gallbladder cancer; GC, gallbladder cholecystitis; GP, gallbladder polyps; IHC, immunohistochemistry; OLFM4, olfactomedin 4; SCC, squamous cell carcinoma.
Amplified TAM interaction and enhanced PD-(L)-1 signalling in OLFM4-positive GBC
To assess the spatial characteristics of GBC associated with OLFM4 expression, GeoMx DSP technology was employed on tissue microarrays (figure 6A). The DSP panel included 6 internal references and 43 proteins, which were categorised into 4 modules (online supplemental table S5). Based on the quantification of PanCK+OLFM4+ cells, 90 samples were divided into two groups: OLFM4-negative (n=58) and OLFM4-positive (n=32) groups (online supplemental figure S5A). The protein expression level in one region of interest of each sample was quantified for further analysis. Upregulation of PD-L1, CD163 and fibronectin was observed in the OLFM4-positive group, while STING declined (figure 6C). Furthermore, tumour-killing effector molecules granzyme B and OX40L, along with CD45RO, were downregulated in the OLFM4-positive group (figure 6D and online supplemental figure S5B). Notably, the proportion of OLFM4+ cells positively correlated with signals related to TAMs and PD-(L)1 signalling (figure 6E), further demonstrated in 15 independent GBC samples (online supplemental figure S5C,D).

OLFM4 positively correlated with TAM infiltration and suppressed antitumour T-cell immunity in vivo. (A) Overview of DSP assay design to investigate spatial heterogeneity of GBC. (B) Representative images of the OLFM4-negative sample and OLFM4-positive sample. (C) Volcanic plot of differentially expressed proteins among groups stratified by OLFM4 expression. (D) Box plot comparing GZMB expression between groups. (E) Pearson correlation of TAM and PD-(L)1 signalling with OLFM4 expression. (F) GBC-SD CTRL/sh-OLFM4 cells were injected subcutaneously into the right flank of NCG mice and transferred with activated PBMC to build the xenograft model. Gross morphology of tumours in the huPBMC-NCG model (CTRL, n=8; sh-OLFM4, n=8). (G) Tumour volume (left) and tumour weight (right) of F were calculated. (H) Subcutaneous injection of GBC-SD CTRL/sh-OLFM4 cells into CD34+ humanised mice to obtain tumour xenografts. Gross morphology of tumours in the huHSC-NCG model (CTRL, n=10; sh-OLFM4, n=10). (I) Tumour volume (left) and tumour weight (right) of H were calculated. (J) Relative expression levels of functional markers of naive-like+ T cells and memory-like+ T cells with tumours in H were determined by cytometry by time of flight. *p<0.05 using a Wilcoxon test. CyTOF, mass cytometry or cytometry by time of flight; DSP, digital spatial profiler; GBC, gallbladder cancer; GZMB, granzyme B; OLFM4, olfactomedin 4; PBMC, peripheral blood mononuclear cells; PD-L1, programmed cell death ligand 1; ROI, region of interest; TAM, tumour-associated macrophage.
Furthermore, scRNA-seq data revealed that OLFM4+epithelium and TAMs interact significantly via ligand-receptor pairs such as ICAM1-integrin, CCL15-CCR1 and AREG-MMP9 (online supplemental figure S5E). The top predicted ligands were more abundant in OLFM4+epithelium than in OLFM4−epithelium, with TAMs expressing corresponding ligands like transforming growth factor beta 1 (TGFB1). Receptors in OLFM4+epithelium for tumour necrosis factor ligands from TAMs are linked to enhanced EMT and tumour invasion (online supplemental figure S5F). Additionally, programmed cell death protein 1 (PD-1) and PD-L1 levels were higher in the OLFM4-positive group, indicating a potential for increased tumour immunity interaction. Besides, PD-1 on lymphoid cells and PD-L1 on malignant epithelium were higher in the OLFM4-positive group, stratified by OLFM4 level in AC (online supplemental figure S6A,B).
To elucidate the potential role of OLFM4 in the immune microenvironment of GBC, loss-of-function studies using the GBC cell lines were conducted (online supplemental figure S6C). Cell Counting Kit-8 assays revealed that the proliferation of GBC was unaffected on OLFM4 knockdown (online supplemental figure S6D). Subcutaneous xenografts in immunodeficient NCG mice implanted with GBC-SD OLFM4 knockdown cells (sh-OLFM4), or control cells (CTRL) showed no significant difference in tumour growth (online supplemental figure S6E,F).
In a subcutaneous xenograft model with pre-activated human peripheral blood mononuclear cells (huPBMC-NCG model) to reconstruct immunity, tumour sizes of GBC-SD sh-OLFM4 were significantly smaller than that of CTRL group, suggesting that OLFM4 knockdown had a noticeable impact on tumour growth when the immune system of NCG mice was partially reconstructed (figure 6F,G). Human CD3+T cells were more abundant in GBC-SD sh-OLFM4 than in the CTRL group (online supplemental figure S6G). The disparities between the two models signify that OLFM4’s role in tumour growth in vivo is imperative to the active involvement of the immune microenvironment.
Next, we used CD34+ haematopoietic stem cell humanised mice (huHSC-NCG) to further confirm the role of OLFM4 in GBC progression. In this model, GBC-SD sh-OLFM4 xenografts were significantly smaller in tumour size and weight compared with CTRL, displaying greater disparity between groups than observed in the huPBMC-NCG model (figure 6H and I). Immune cell subset analysis using cytometry by time of flight focused primarily on T-cell markers identified four T-cell subsets: naive-like, memory-like, natural killer T (NKT) and CD161+T cells (online supplemental figure S6H,I and table S6). In the OLFM4-CTRL group, functionally exhausted T cells marked by CD27 and OX40 belonging to the tumour necrosis factor receptor superfamily were elevated, and ICB genes like T-cell immunoglobulin and mucin domain 3 (TIM-3) and PD-1 were upregulated (figure 6J and online supplemental figure S6J). Furthermore, multiplex IHC staining highlighted increased TAM infiltration in OLFM4-CTRL tumours (online supplemental figure S6K,L). In summary, our data indicated that OLFM4-positive tumour cells regulated immune response in GBC by intensive crosstalk with TAM and modulating T-cell function.
OLFM4 impaired immune responses by upregulating PD-L1 through MAPK-AP1 axis
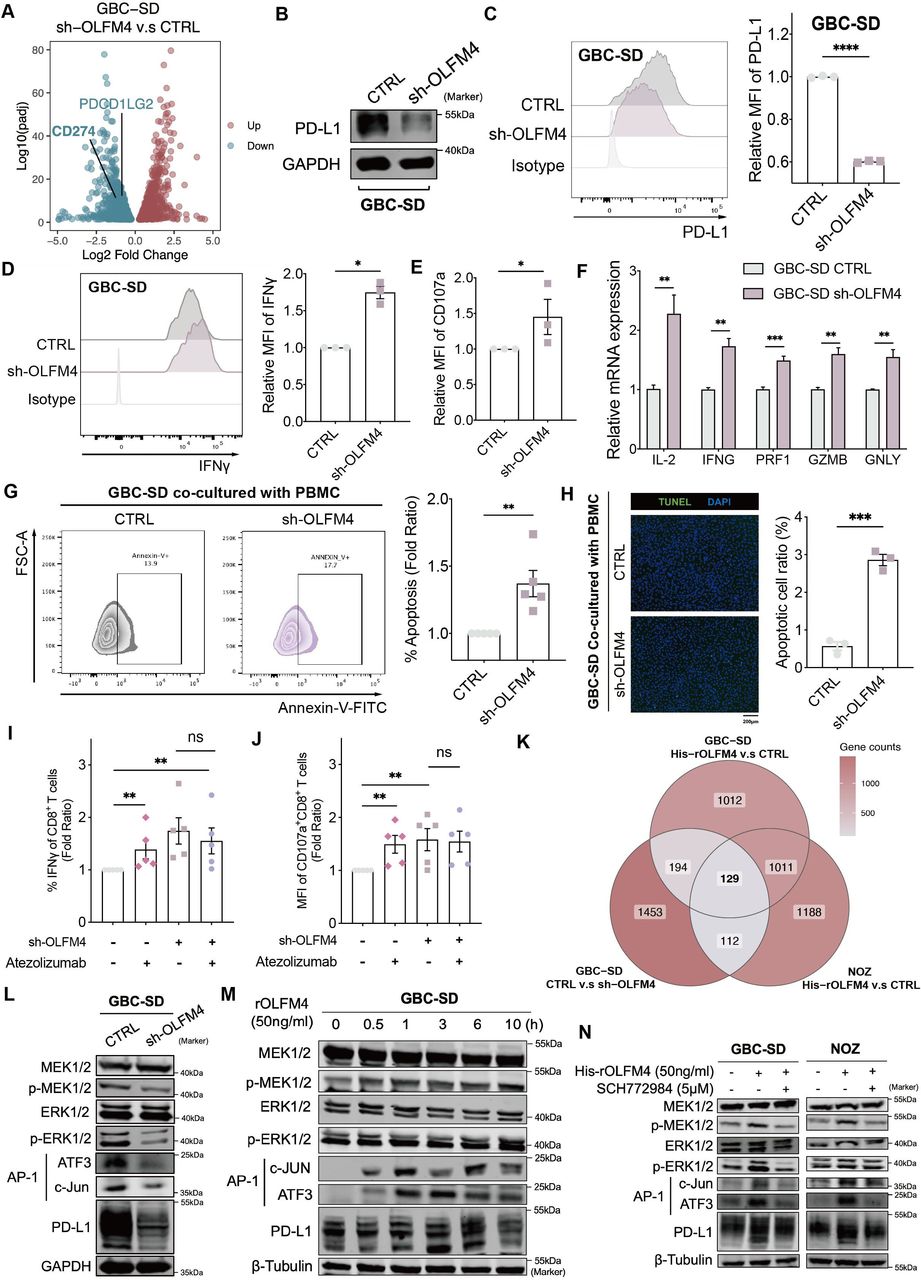
To delineate the mechanism behind OLFM4-mediated immune response, we conducted bulk RNA-seq analysis on GBC-SD sh-OLFM4 and CTRL cells. Among immune checkpoint molecules, CD274, encoding PD-L1, emerged as the key candidate (figure 7A). OLFM4 knockdown led to a reduction in PD-L1 expression at both messenger RNA (mRNA) and protein levels, with or without exogenous interferon (IFN)-γ stimulation (figure 7B,C, online supplemental figure S7A–C). Conversely, introducing recombinant OLFM4 protein (50 ng/mL) induced a time-dependent increase in PD-L1 mRNA and protein expression within 4 hours (online supplemental figure S7D,E). Notably, this time-dependent elevation of PD-L1 by OLFM4 was demonstrated in several cancer cell lines, including human colorectal AC (SW620 and HT-29), human gastric cancer (MGC803 and AGS) and human pancreatic cancer (SW1990 and PANC-1) cell lines (online supplemental figure S7F). These data strongly suggest that OLFM4 may substantially impact the expression of PD-L1 in multiple cancer types beyond GBC.

OLFM4 impaired immune response via the MAPK-AP1-PD-L1 axis. (A) Volcano plot for the differentially expressed genes after OLFM4-knockdown in GBC-SD (adjusted p<0.05). (B) Expression levels of PD-L1 determined by western blot in OLFM4 knockdown GBC cells. (C) PD-L1 expression in OLFM4-knockdown GBC-SD cells analysed by flow cytometry (left). Bar plot comparing the relative mean fluorescence intensity (MFI) of PD-L1 (right). (D) Intracellular IFN-γ of CD8+T cells detected by flow cytometry after co-culturing with GBC-SD CTRL/sh-OLFM4 cells for 72 hours. Bar plot compared the relative MFI of IFN-γ (n=3, *p<0.05). (E) Bar plot comparing the relative MFI of CD107a from CD8+T cells co-cultured with GBC-SD CTRL/sh-OLFM4 cells (n=3, *p<0.05). (F) Quantitative RT-PCR performed to detect IL-2 (interleukin-2), IFN-G (IFN-γ), PRF1 (perforin-1), GZMB (granzyme) and GNLY (granulysin) in activated PBMCs co-cultured with GBC-SD CTRL/sh-OLFM4 cells (n=3, *p<0.05). (G) Activated PBMCs were co-cultured with GBC-SD CTRL/sh-OLFM4 cells for 72 hours at the ratio of 4:1. The PBMCs were collected and stained with FITC-annexin V, then subjected to flow cytometry analysis. The percentage of apoptotic cells was analysed (right panel). (H) Cell apoptosis in PBMC co-cultured GBC cells evaluated by transferase dUTP nick end labelling assay (left panel). The apoptotic cell ratios were shown (right panel). (I) Relative proportion of IFN-γ+CD8+T cells following a 72-hour co-culture with GBC-SD CTRL/sh-OLFM4 cells, in the presence or absence of atezolizumab (10 µg/mL) treatment. (J) Relative MFI of CD107a+CD8+T cells following a 72-hour co-culture with GBC-SD CTRL/sh-OLFM4 cells, in the presence or absence of atezolizumab (10 µg/mL) treatment. (K) Venn diagram illustrating overlapping genes in GBC cell lines with OLFM4 stimulation or knockdown. (L) Western blot analyses of total MEK1/2, p-MEK1/2, total ERK1/2, p-ERK1/2, AP-1 complex and PD-L1 levels in GBC-SD CTRL and GBC-SD sh-OLFM4. (M) Western blot analyses of total MEK1/2, p-MEK1/2, total ERK1/2, p-ERK1/2, AP-1 complex and PD-L1 levels in GBC-SD treated with OLFM4 (50 ng/mL). (N) Western blot analyses of total MEK1/2, p-MEK1/2, total ERK1/2, p-ERK1/2, AP-1 complex and PD-L1 levels in GBC-SD and NOZ treated with OLFM4 (50 ng/mL) combined with or without ERK1/2 pathway inhibitor (SCH772984). GBC, gallbladder cancer; IFN, interferon; mRNA, messenger RNA; OLFM4, olfactomedin 4; PBMC, peripheral blood mononuclear cells; PD-L1, programmed cell death ligand 1; RT-PCR, reverse transcription polymerase chain reaction.
T cell-mediated killing assay was conducted to assess whether OLFM4-regulated PD-L1 influenced T-cell function in vitro. Cytotoxic T-cell activities, as indicated by effectors (IFN-γ, CD107a and granzyme), were upregulated when co-cultured with GBC shOLFM4 (figure 7D, E and F; online supplemental table S7). Simultaneously, apoptotic tumour cells increased in OLFM4-knockdown cells after co-culturing with PBMC, as detected by flow cytometry and terminal deoxynucleotidyl transferase dUTP nick end labelling assay (figure 7G,H). Treatment with atezolizumab (anti-PD-L1 antibody, 10 µg/mL) reversed T-cell-mediated killing enhancement in a co-culture system. While administration of atezolizumab to the sh-OLFM4 group did not result in enhanced IFN-γ secretion by CD8+T cells (figure 7I,J, online supplemental figure S7G,H).
Given the in vitro and in vivo induction of PD-L1 expression by OLFM4, we investigated the underlying mechanism. Tunicamycin inhibition and cycloheximide chase assays were conducted to assess the role of OLFM4 in PD-L1 expression, revealing no significant influence at the protein level (online supplemental figure S7I,J). Then, transcriptomic profiling of GBC cell lines identified 129 downstream genes enriched in the MAPK cascade and AP-1 pathway (figure 7K and online supplemental figure S7K). In OLFM4-knockdown GBC-SD cells, a significant decrease in p-MEK1/2 and p-ERK1/2 expression within the MAPK pathway was confirmed by western blot. Subsequently, protein levels of the downstream transcription factor AP-1 and target gene PD-L1 were also reduced (figure 7L). Likewise, the introduction of exogenous OLFM4 to GBC cell lines GBC-SD and NOZ resulted in elevated levels of p-MEK1/2, AP-1 and PD-L1 (figure 7M and online supplemental figure S7L). Conversely, ERK1/2 pathway inhibitor SCH772984 could block the activation effect of recombinant OLFM4 (figure 7N).
Collectively, these findings underscore the pivotal role of OLFM4 in activating the PD-1/PD-L1 axis and subsequently inhibiting T-cell function within but possibly not limited to GBC.
Discussion
GBC manifests as a highly lethal disease with wide geographical prevalence, which is closely linked to persistent inflammation. It is noteworthy that the onset of GBC does not always correlate with cholelithiasis, and polypoid lesions, particularly adenomas, are found associated with GBC progression. Despite the well-known pathological sequence of GBC, limited investigations have explored the association of their ecosystem with disease progression. Our study comprehensively investigated the cellular landscape and molecular features of gallbladder diseases of cholecystitis, polypoid lesions and GBC by multiomics including WGS, bulk RNA-seq and scRNA-seq to decipher the microenvironment heterogeneity in disease evolution (figure 8).

Summary of immune features and dynamics of the ecosystem among gallbladder diseases within this study. AC, adenocarcinoma; CAF, cancer-associated fibroblast; CyTOF, cytometry by time of flight; GMC, glandular mucosal cell; OLFM4, olfactomedin 4; PD-1, programmed cell death protein 1; PD-L1, programmed cell death ligand 1; SCC, squamous cell carcinoma; scRNA-seq, single-cell RNA sequencing; TCGA, The Cancer Genome Atlas.
Exploration of the ecosystem offers insights into GBC pathogenesis and targeted molecular therapy. ScRNA-seq revealed a cell atlas of 69 subpopulations, showcasing diverse cell types within gallbladder diseases. Distribution patterns highlighted similarities between ANT and GC, as well as GP and GA. GBC displayed an enrichment of immune suppressive and stromal cells. Notably, the variation in TCR expansion patterns, cycling T cells, and myeloid cells significantly inform potential immunotherapeutic strategies for gallbladder diseases by targeting T-cell populations key to disease progression.36 Stromal cell analysis unveiled significant heterogeneity, categorising stromal cells into SC1, SC2 and SC3, with SC1 and SC3 predominantly in GBC samples. SC1-like patients exhibited enriched pro-tumour pathways and poorer outcomes, which could serve as an accountable prognosis indicator. In addition, epithelium among AC samples could be classified into eight meta-programmes according to molecular features indicating distinct biological functions such as immune response, EMT, etc, unveiling the heterogeneity within AC and offering valuable insights into molecular classification-based therapy.
Notably, a significant elevation of OLFM4 expression was found in malignant GBC epithelium by scRNA-seq data. Subsequent investigations revealed that OLFM4-positive cells were intensively enriched in AC and moderately elevated in GA tissues. Given that OLFM4 could be secret to extracellular space, our data also indicated a significant elevation of OLFM4 in the serum of GA and AC patients. Pseudotime analysis of epithelium evolution also revealed overlapped states of GA and AC, suggesting a potential evolutionary similarity between them. Considering GA is a recognised precancerous lesion of GBC, this similarity suggests a plausible evolution of GBC from GA.
Previous research has delineated an upregulation of OLFM4 across the continuum from GC, dysplasia to GBC and associated with patient survival, aligning with our findings.37 While this study mainly highlighted the sensitisation of GBC to cisplatin on OLFM4 depletion, we focused on the role of OLFM4+GBC cells on the immune microenvironment, particularly the inhibitory effect of OLFM4 on modulating T cells via regulating PD-L1 expression. Spatial proteomics revealed that the OLFM4-positive group exhibits strong interactions with TAM and enhanced PD-(L)1 signalling, with further in vitro and in vivo experiments confirming OLFM4’s role in modulating PD-L1 and recruiting TAM. Besides, cancer-associated fibroblast (CAF) is prominent components of the microenvironment of GBC. iCAF has been linked to tumour escape via chemoattraction, participating in promoting angiogenesis and induction of immunosuppressive cells.38 39 ScRNA-seq data also indicated SC1, predominantly comprising iCAFs and Endo-Tip cells within GBC, was associated with a worse prognosis. Given the intricate interplay among malignant cells, immune constituents and CAFs, it is plausible that OLFM4 may modulate the functionality of CAFs, either directly or indirectly. Moreover, OLFM4 upregulated PD-L1 in other cell lines such as gastric cell lines and pancreatic cell lines, suggesting its potential role on TME in more tumours other than AC, possibly tumours of epithelial origin.
Our study sheds light on key molecular elements of GBC pathogenesis but needs further exploration due to limitations like small sample sizes in certain GBC types, affecting the generalisability of our findings. The specific functions of identified T cells and myeloid cells in gallbladder disease warrant further study. Furthermore the function of OLFM4 in the progression of GBC should be further elucidated to evaluate its potential as a prognosis marker or therapeutic target for gallbladder diseases. In summary, the intricate interaction between different cell subtypes constructs a complex ecosystem promoting GBC pathogenesis, further research was needed to make breakthroughs in understanding the diseases and ultimately improve clinical outcomes for patients.
Data availability statement
Data are available upon reasonable request.
Ethics statements
Patient consent for publication
Ethics approval
The study adhered to the principles of the Declaration of Helsinki and was approved by the ethics committee of Eastern Hepatobiliary Surgery Hospital (EHBH) (No. EHBHKY2023-K049-P001). Participants gave informed consent to participate in the study before taking part.
Acknowledgments
We appreciate the support from the Shanghai Key Laboratory of Hepatobiliary Tumor Biology and the Ministry of Education Key Laboratory on Signaling Regulation and Targeting Therapy of Liver Cancer, Naval Medical University (Second Military Medical University), Shanghai, China. We also want to thank Shan-Hua Tang, Dan Cao, Ji Hu and Lu Chen for their technical assistance.
References
Supplementary materials
Supplementary Data
This web only file has been produced by the BMJ Publishing Group from an electronic file supplied by the author(s) and has not been edited for content.
Footnotes
HH, SC and YY contributed equally.
Contributors HH, SC, YY, HW and WW designed the study. HH, YY, YQ and WW developed the methodology. HH, SL, ZF, WH and WL. acquired data. HH, SC, YD, ZF and WW analysed and interpreted data. HH and WW wrote the manuscript. HH, SC, HW and WW reviewed the manuscript. SL, XS, YS, JY, QC, CZ, MZ and XW provided technical and material support. DW and JW performed the DSP experiment. HW and WW supervised the study. As the guarantor, WW is fully responsible for the overall work and the conduct of the study.
Funding This work was supported by the National Natural Science Foundation of China (82173146, 81830054, 81988101 and 82072600). The Major Program of the Shanghai Education Committee (2019010700007E00065), the plan of the Shanghai Municipal Health Commission (2022XD036), the National Science Foundation of Shanghai (21JC1406600, 20DZ2291900 and 23692123600). The Shanghai Science and Technology Committee Rising-Star Program (21QA1411700) also provided funding to conduct this project.
Competing interests None declared.
Provenance and peer review Not commissioned; externally peer reviewed.
Supplemental material This content has been supplied by the author(s). It has not been vetted by BMJ Publishing Group Limited (BMJ) and may not have been peer-reviewed. Any opinions or recommendations discussed are solely those of the author(s) and are not endorsed by BMJ. BMJ disclaims all liability and responsibility arising from any reliance placed on the content. Where the content includes any translated material, BMJ does not warrant the accuracy and reliability of the translations (including but not limited to local regulations, clinical guidelines, terminology, drug names and drug dosages), and is not responsible for any error and/or omissions arising from translation and adaptation or otherwise.